About Me

I'm Mark Ashlee Mori, a Data Scientist with a degree in Mechanical Engineering and almost 5 years of experience in data science, analytics engineering, and machine learning. I build data infrastructures, automate ETL pipelines, and design predictive models that drive business value and operational efficiency.
My career began at Taiyo Yuden (Cebu) with dashboard design and exploratory data analysis, followed by Holisto PH where I focused on ETL automation and dashboard creation. At Spark Ignite, I established the company's data infrastructure from scratch, implementing ETL workflows and BI solutions using Python, SQL, and cloud tools.
At Conversion Interactive Agency, I replaced their costly Fivetran subscription with a custom Python-based ETL solution, deployed using Docker and Google Cloud Run. This system now supports 500+ client accounts, significantly reducing operational costs while improving scalability and control. The migration is estimated to have generated $50,000–$100,000 in annual cost savings for the company.
Currently, as a Full Stack Data Scientist at Comprehensive Rehab Consultants, I lead data architecture design and implementation, developing automated ETL processes on Google Cloud Platform. I manage dashboard development across Power BI, Looker, and Preset platforms, transforming healthcare data into actionable insights.
My expertise spans predictive modeling, data visualization, and machine learning deployment, using Python, SQL, and cloud technologies. I specialize in optimizing workflows and implementing data-driven strategies that enhance decision-making and operational efficiency across industries.
Certificates
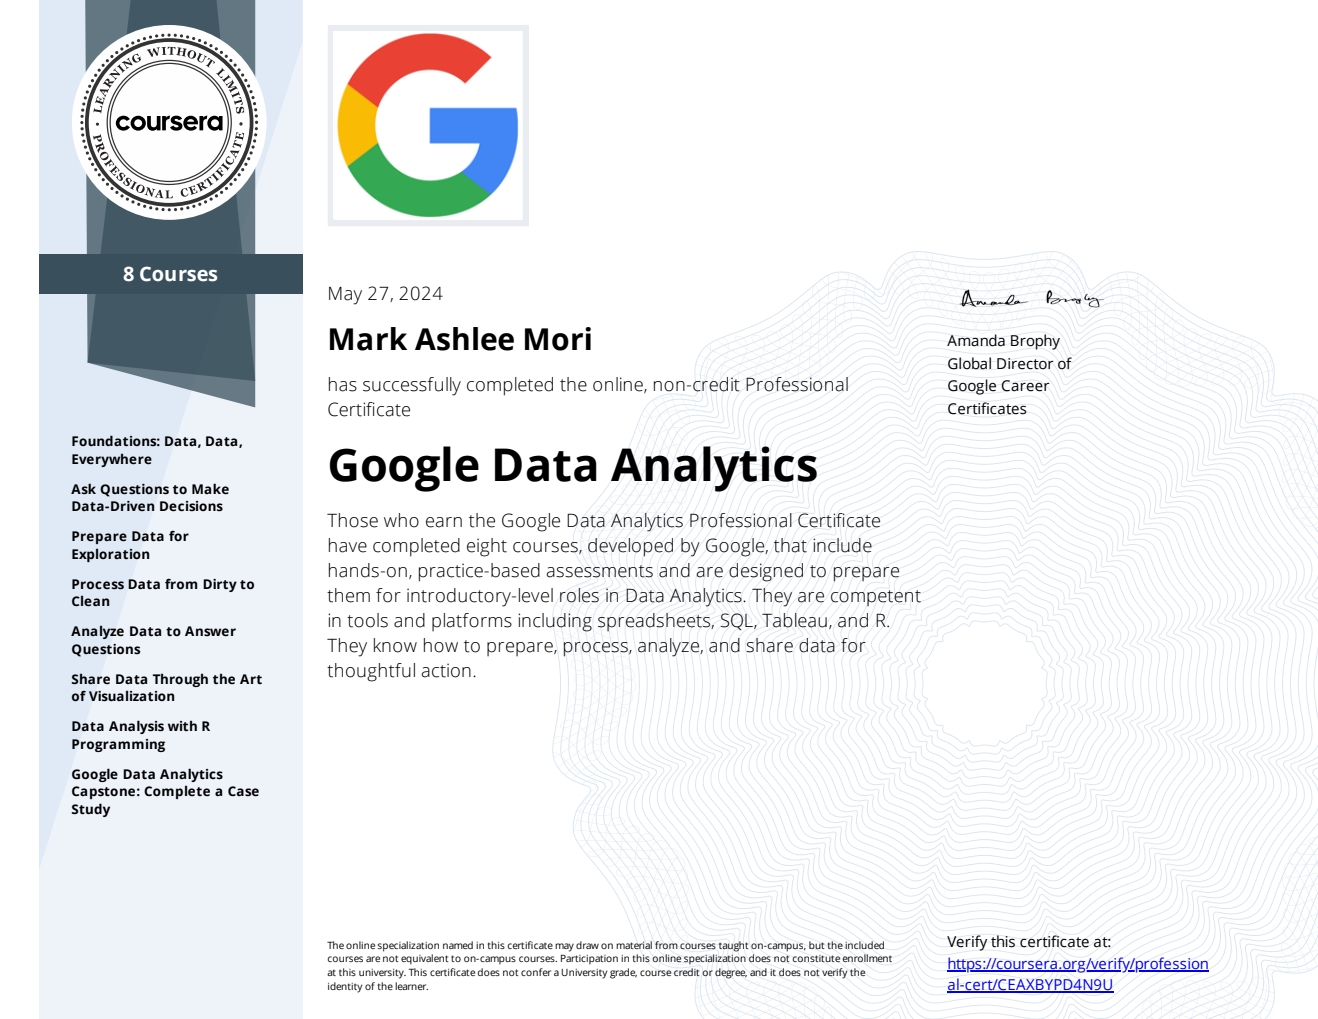
Google Data Analytics Professional Certificate
Python for Data Science, AI & Development

Supervised Machine Learning: Regression and Classification

Foundations of Data Science

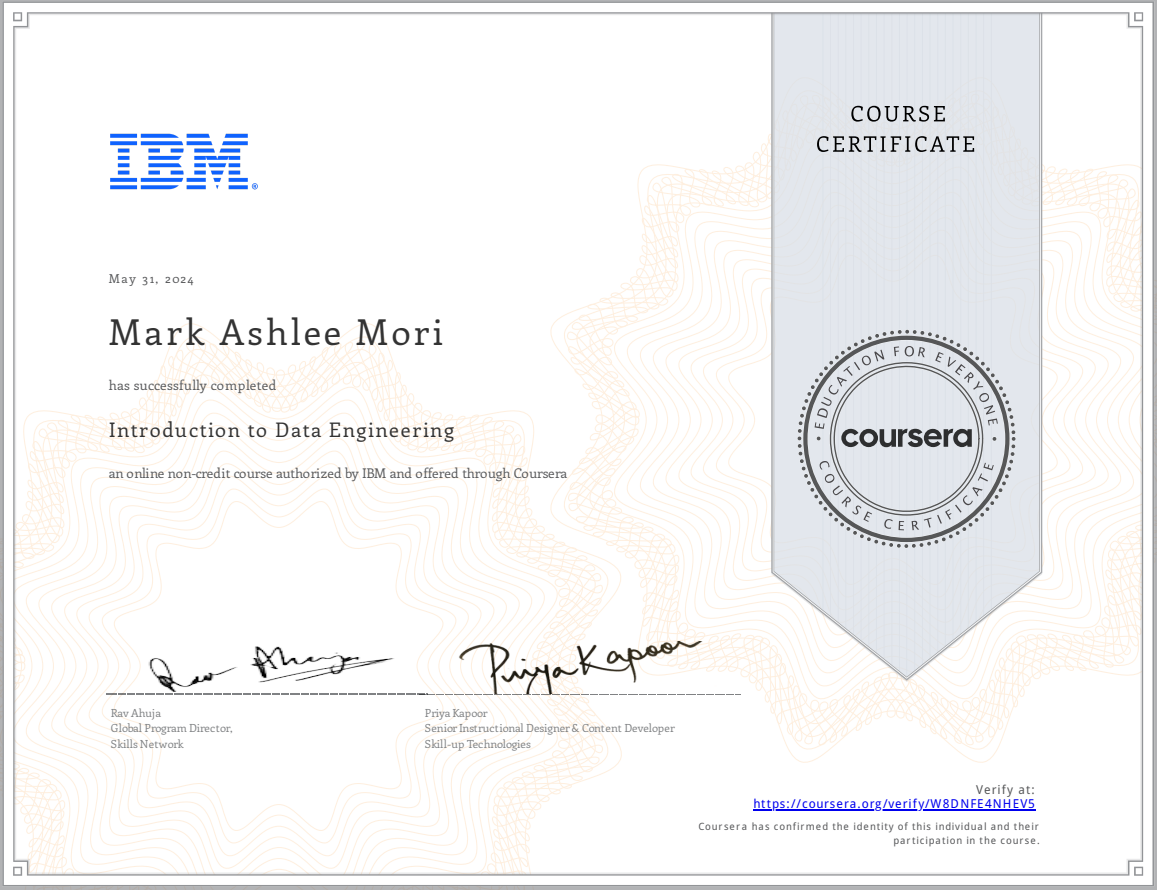
Introduction to Data Engineering
Get Started with Python

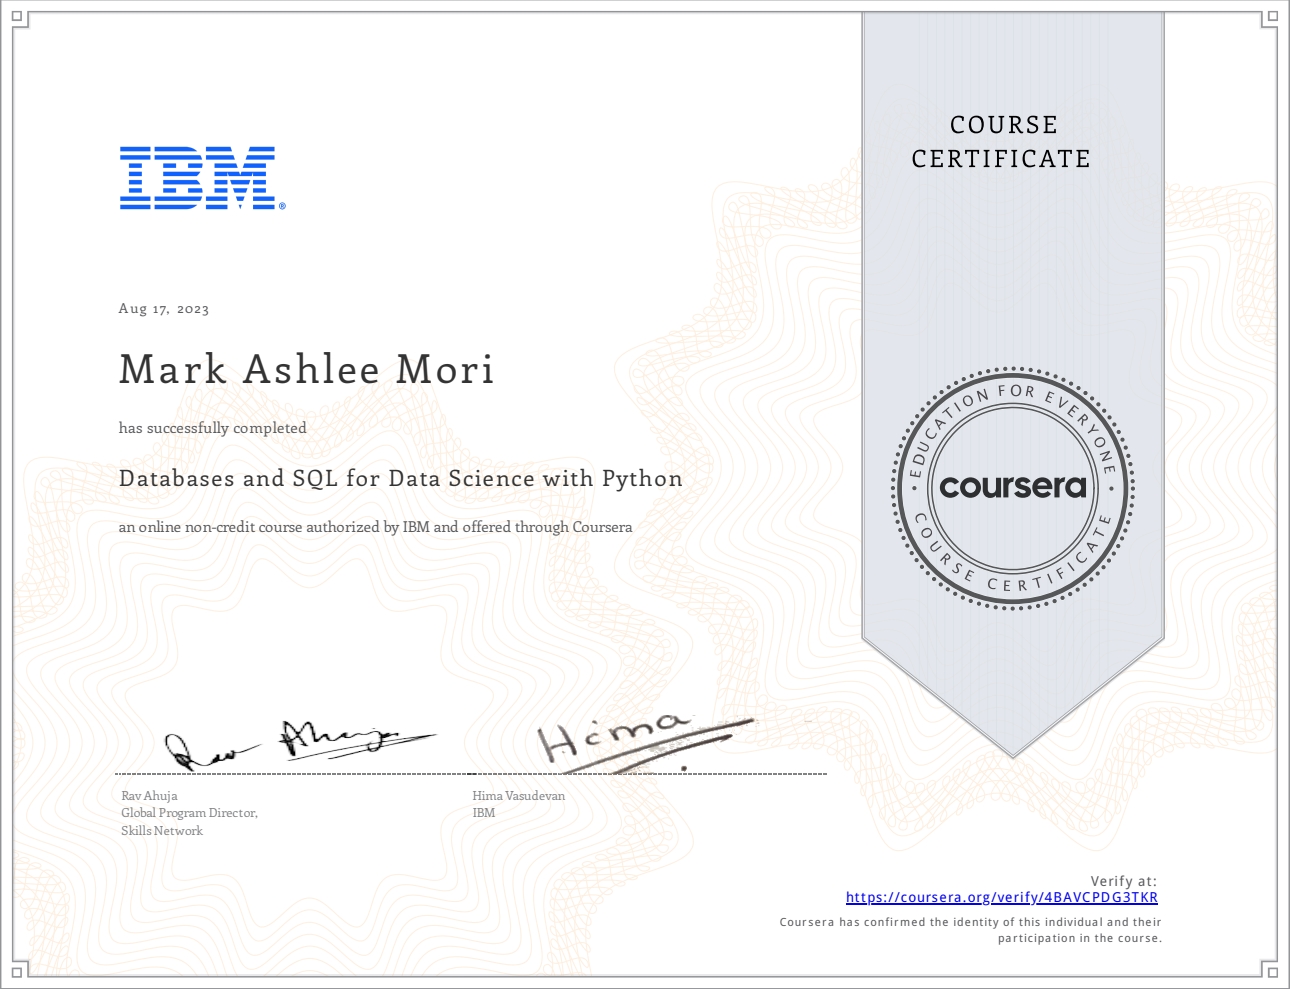
Databases and SQL for Data Science with Python
Data Analysis with R Programming

The Bits and Bytes of Computer Networking

Share Data Through the Art of Visualization

Contact
Personal Projects
Note: Majority of the projects I've worked on are company projects, and in some cases, they are confidential.
Looker Studio Dashboards
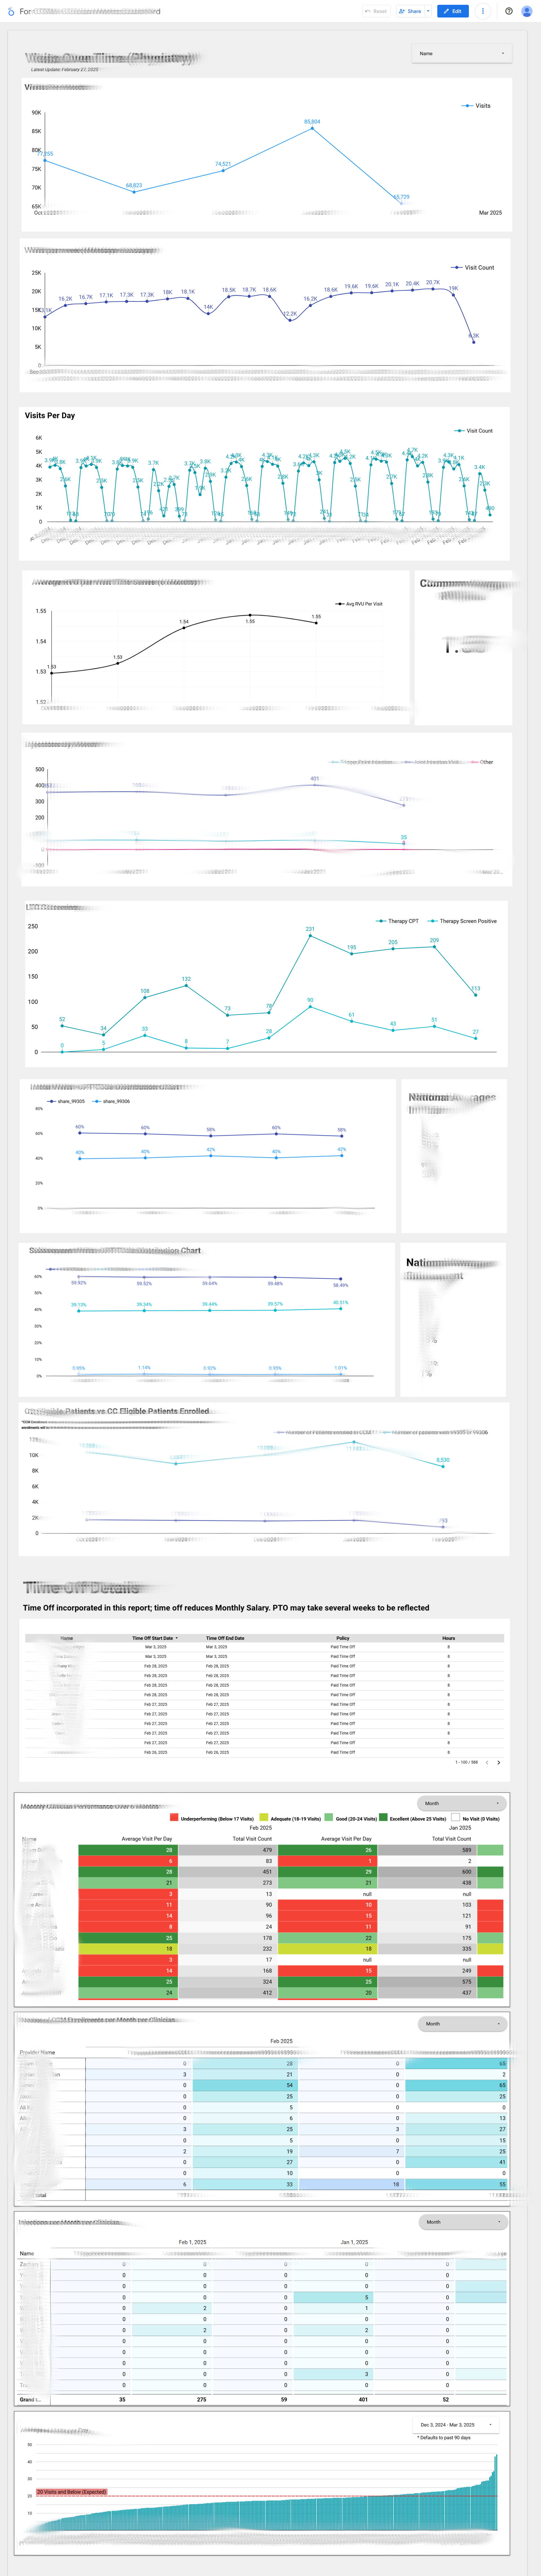
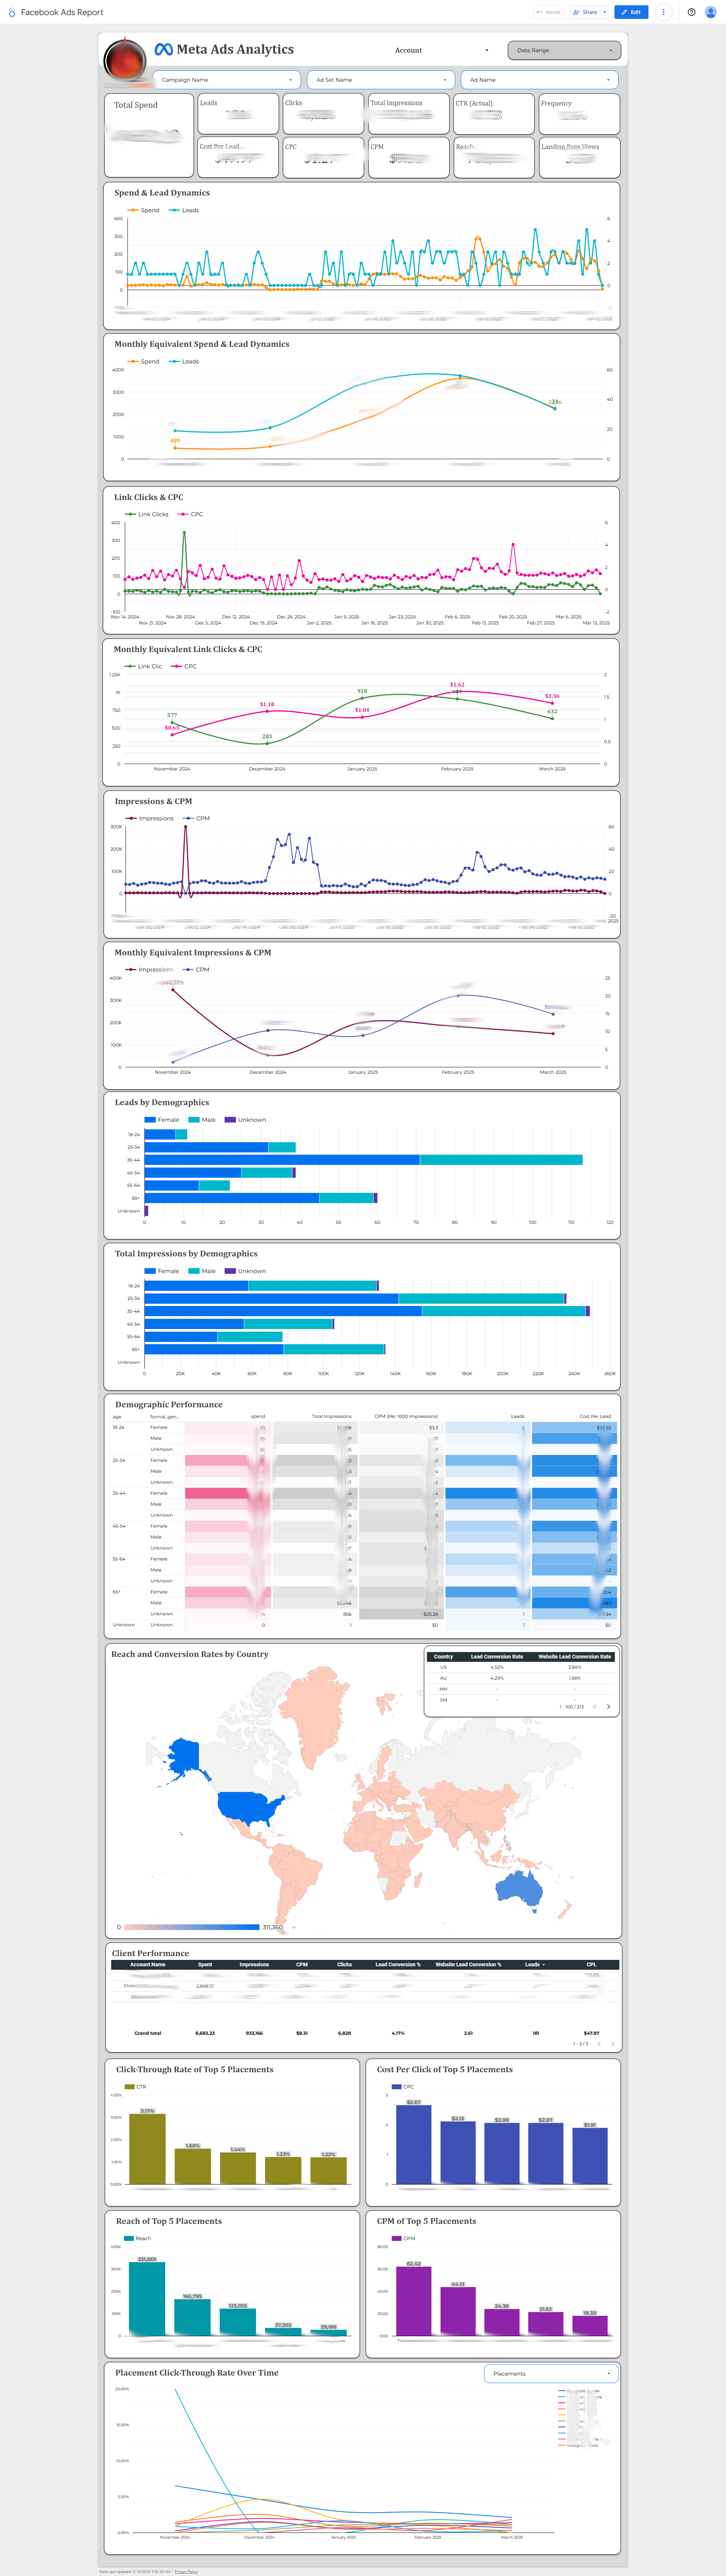
I develop interactive data visualizations using Looker Studio to help stakeholders gain actionable insights from complex datasets. My approach focuses on creating intuitive, performance-optimized dashboards that deliver business value. For security and confidentiality reasons, portions of the content and sensitive information have been intentionally blurred
Featured Dashboard
This dashboard showcases my ability to create visually compelling data stories that highlight key metrics and trends:
Dashboard Development Approach
My Looker Studio development process follows these principles:
- User-Centered Design: Creating visualizations tailored to stakeholder needs and decision-making processes
- Performance Optimization: Structuring underlying data models and queries for fast loading and response times
- BigQuery Integration: Leveraging direct connections to BigQuery for efficient data processing
- Interactive Elements: Implementing filters, parameters, and drill-downs for deeper exploration
- Consistent Branding: Adhering to organizational visual guidelines while maintaining clarity
This dashboard connects directly to data stored in Google BigQuery and automatically refreshes as new data becomes available through my ETL pipeline. The visualizations provide stakeholders with real-time insights without requiring technical knowledge of the underlying data structure.
Python ETL & BigQuery Code Examples
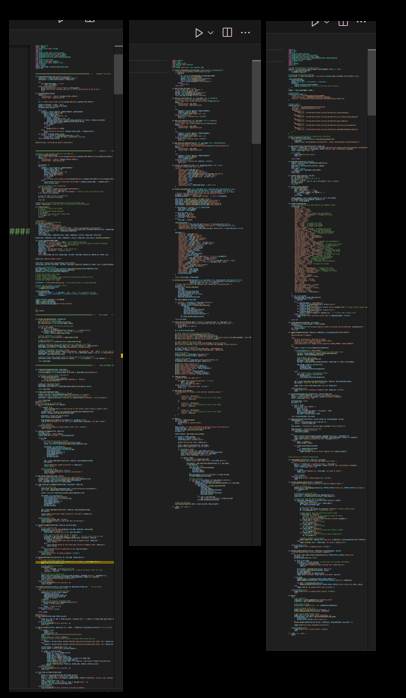
This section showcases examples of my Python-based ETL (Extract, Transform, Load) pipelines and BigQuery implementations. For security and confidentiality reasons, portions of the content and sensitive information have been intentionally blurred.
ETL Pipeline Architecture
My ETL pipeline architecture follows modern data engineering practices, incorporating:
- Modular Design: Separate modules for extraction, transformation, and loading to ensure maintainability
- Error Handling: Robust error logging and exception management
- Scalability: Parallel processing for handling large data volumes
- Monitoring: Comprehensive logging for tracking pipeline health

BigQuery Integration
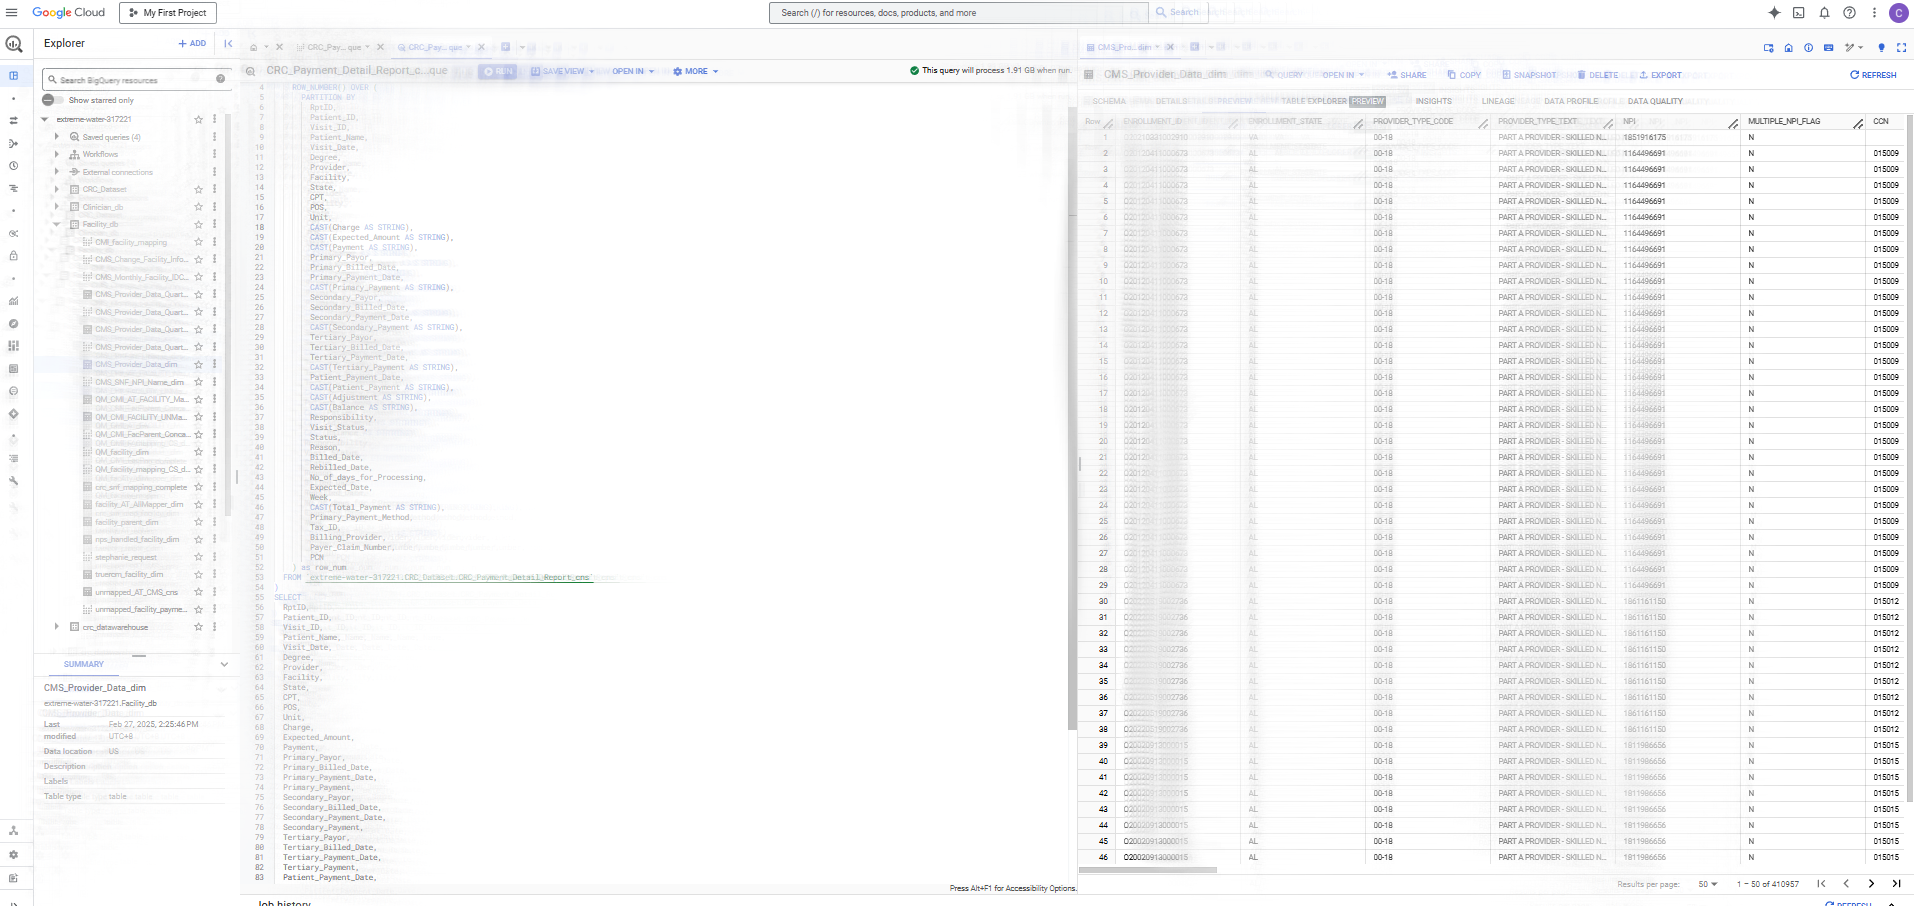
This example shows how I load processed data into BigQuery and optimize query performance:
Containerization with Docker and Cloud Deployment
My Dockerfile and container configuration for deploying the ETL pipeline:
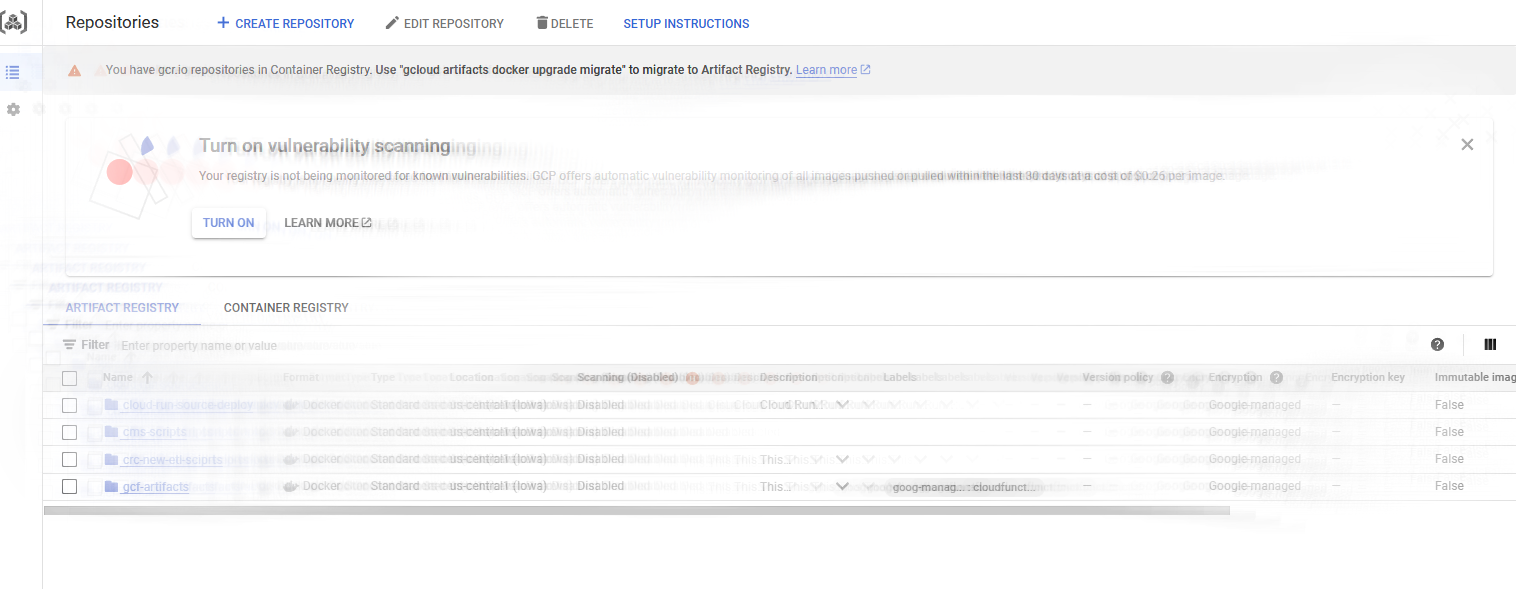
Note: These examples represent my approach to data engineering, though specific implementation details have been obscured to protect proprietary information and security.
PowerBI Projects
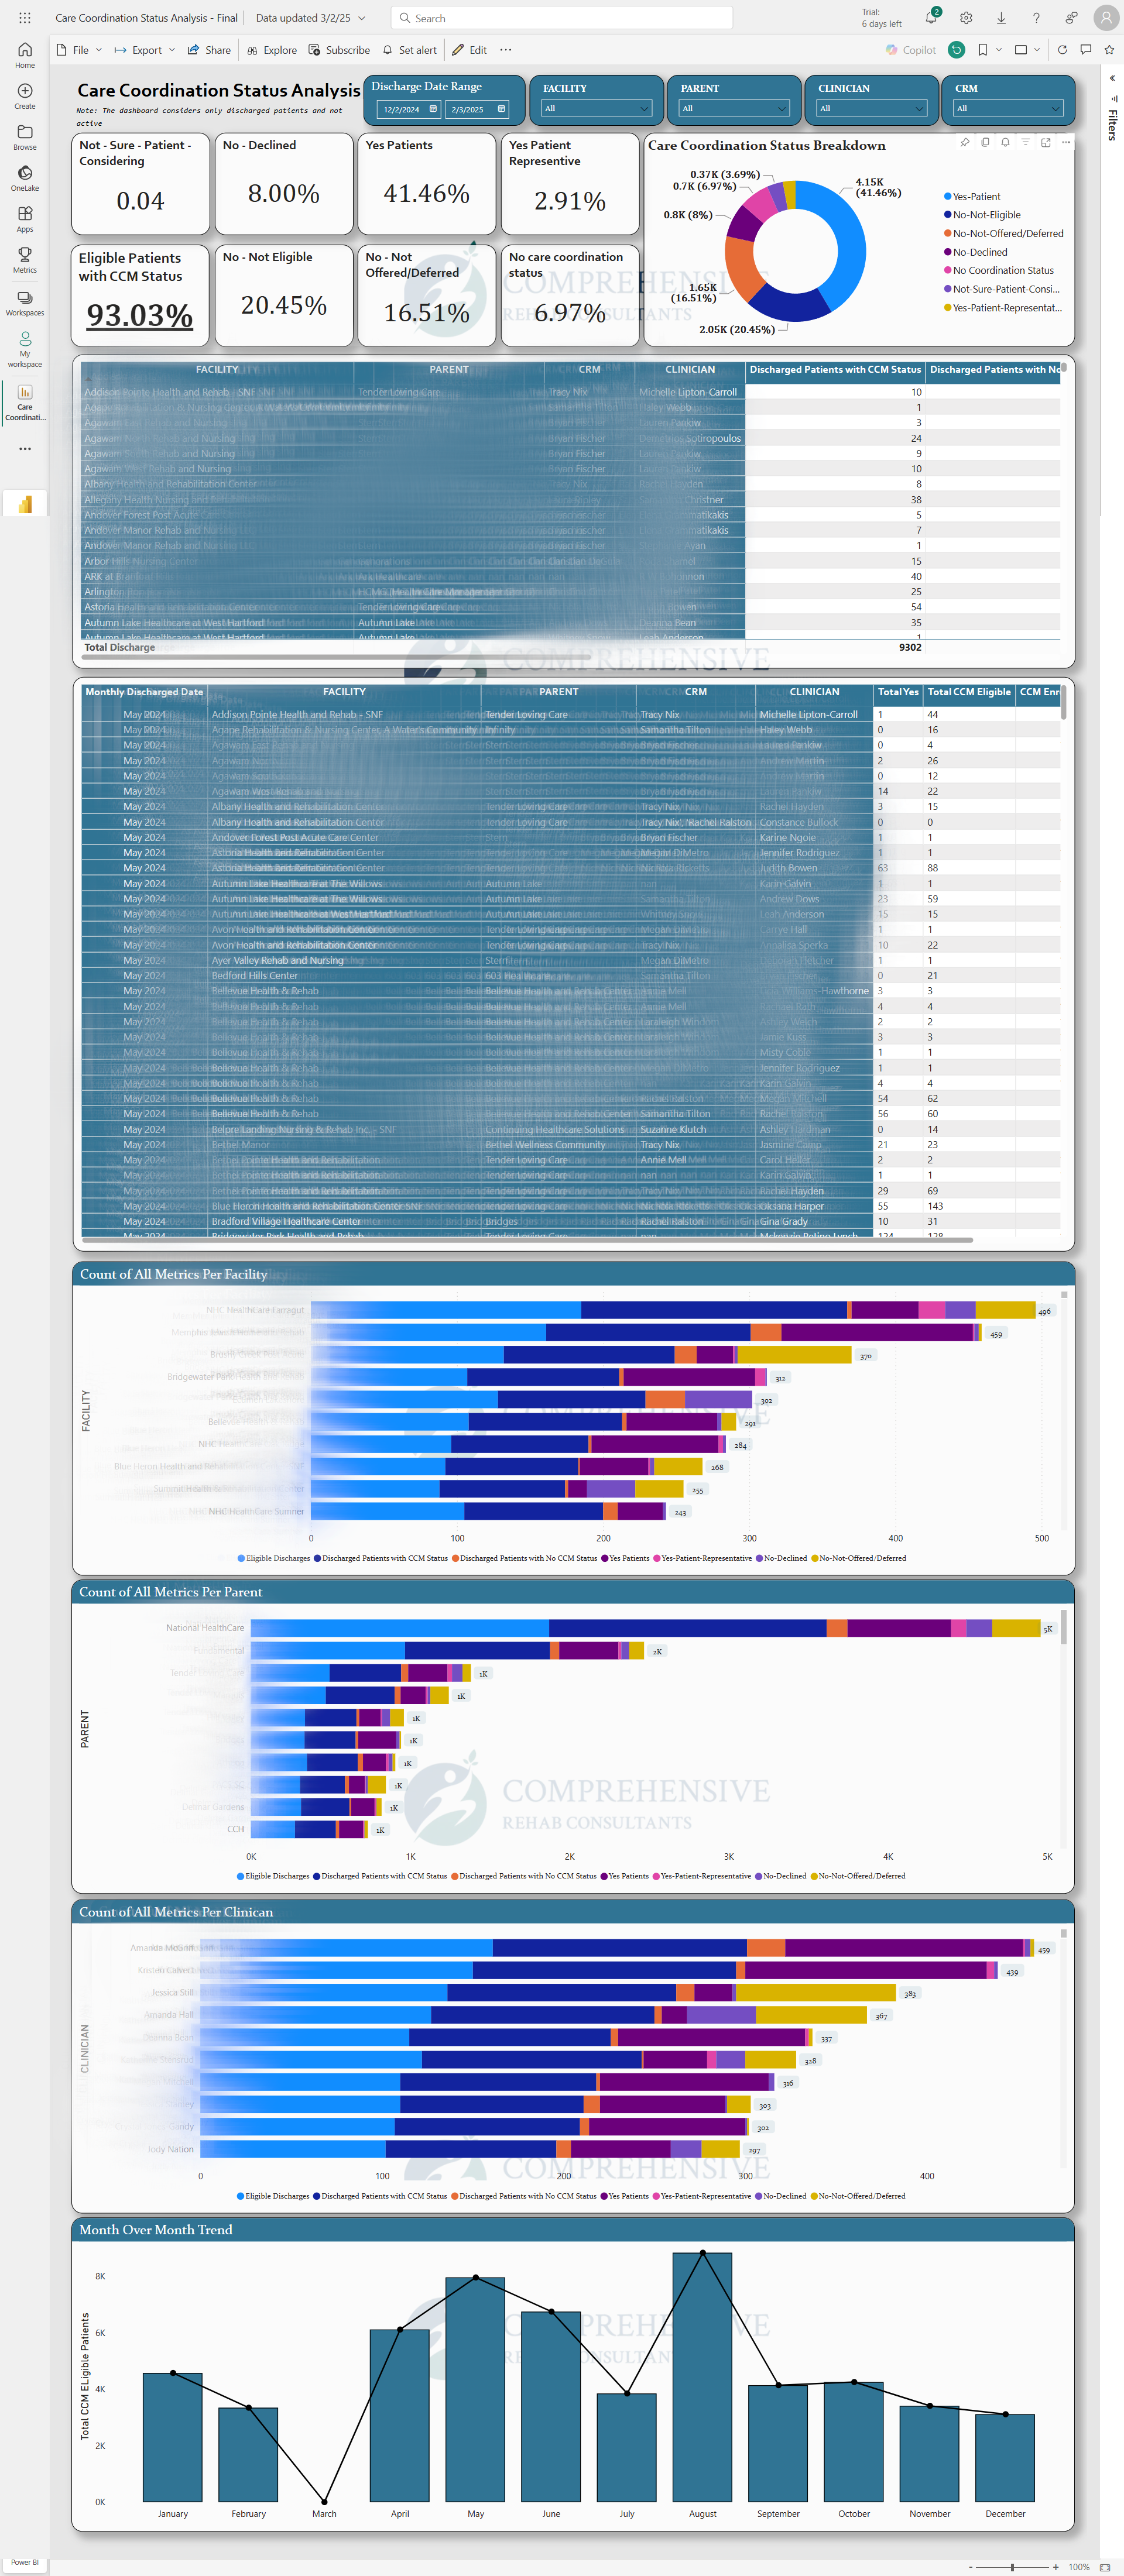
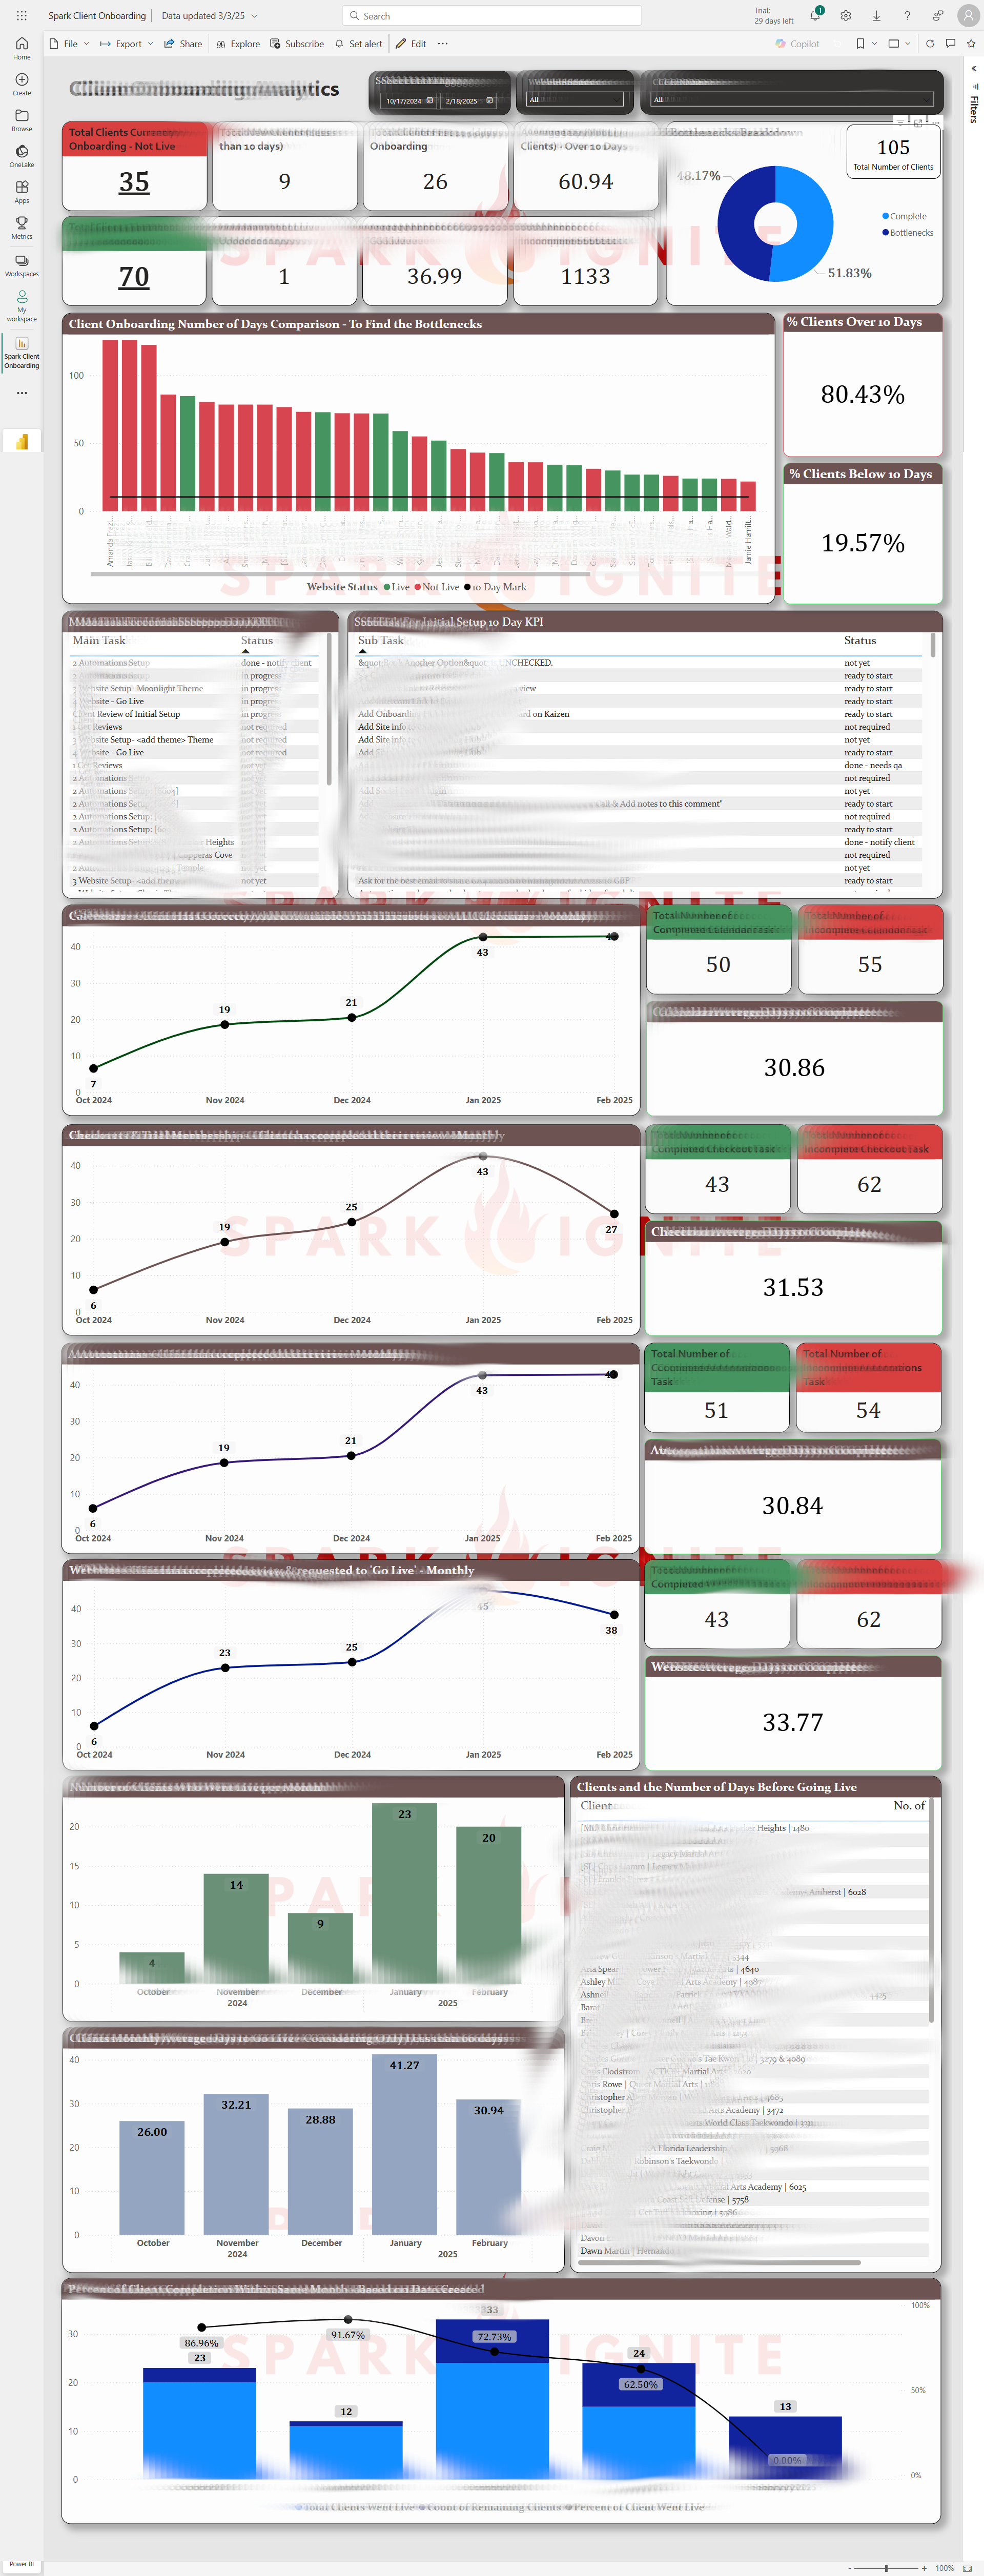
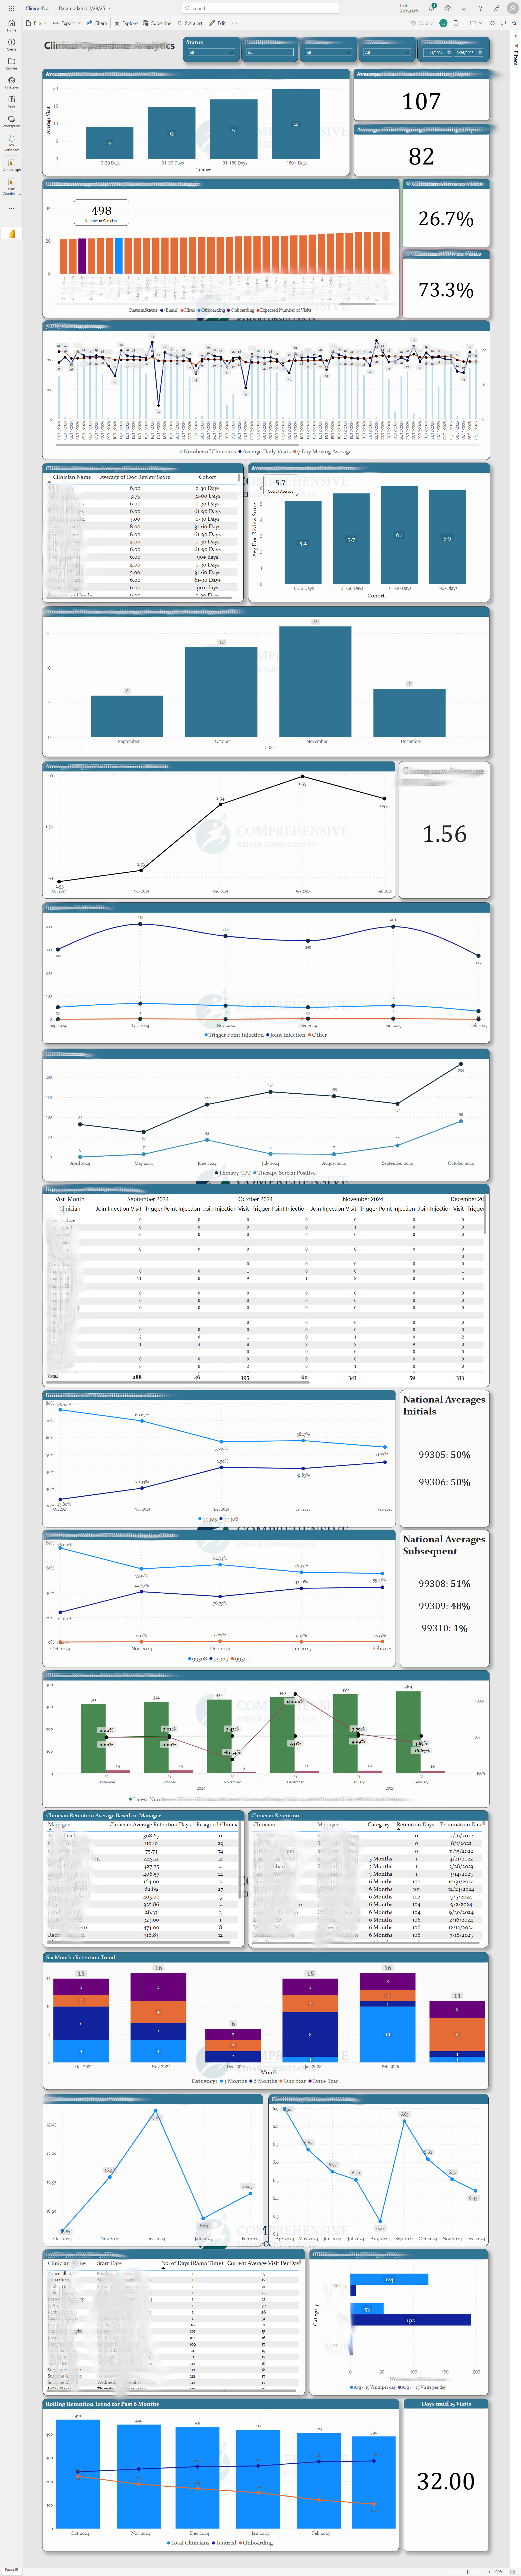
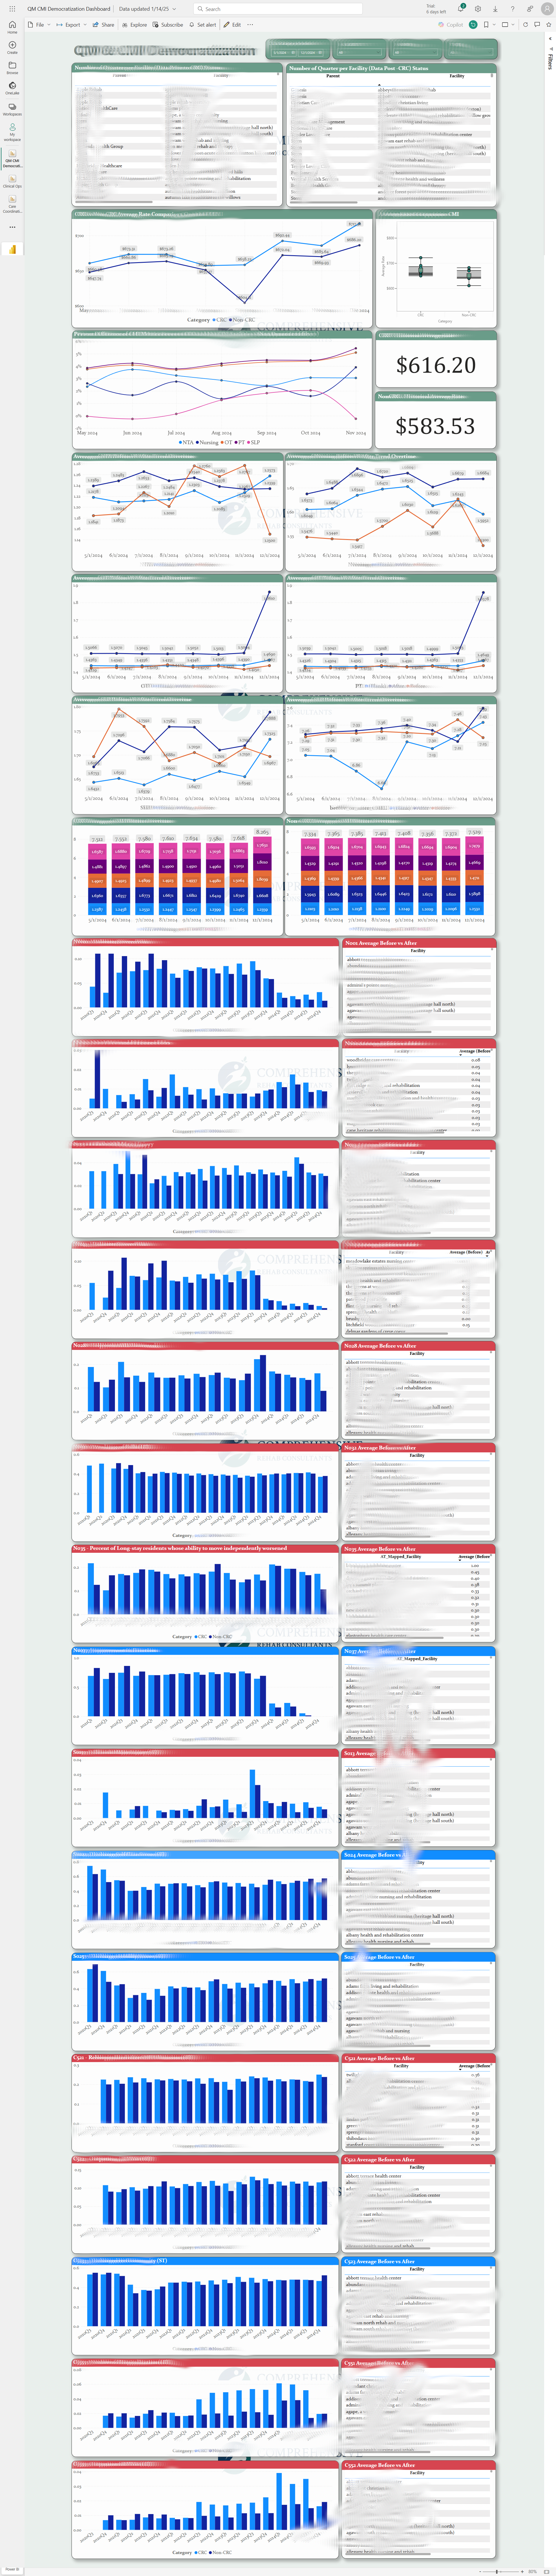
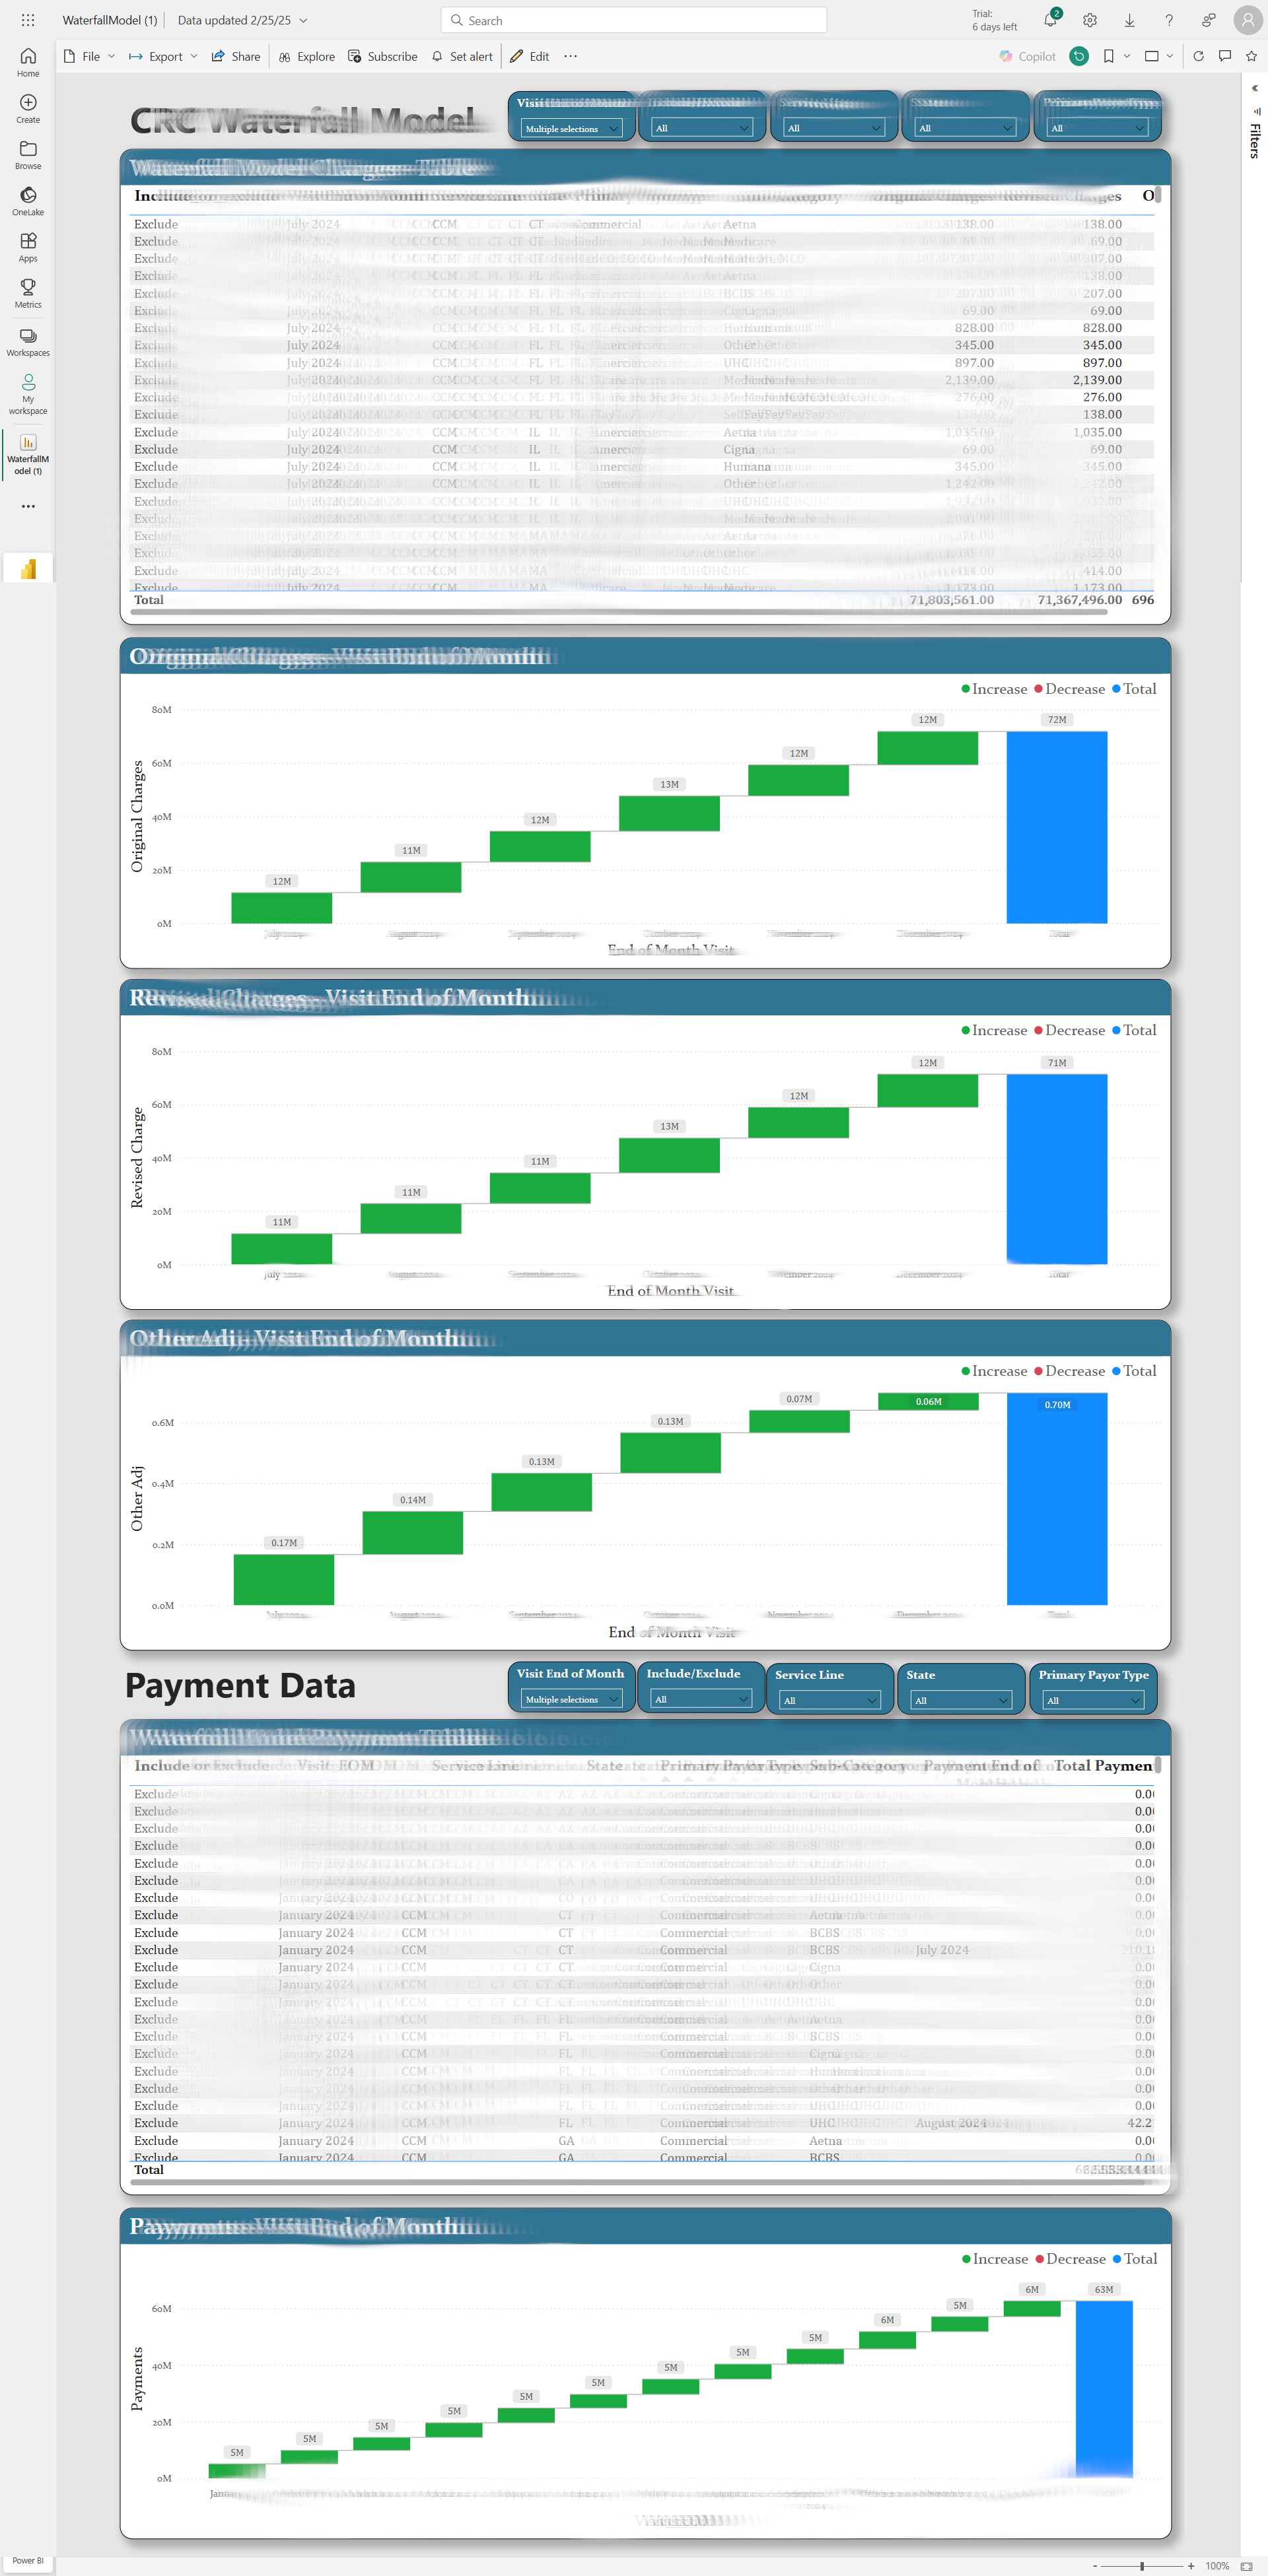
This PowerBI dashboard is part of a comprehensive data solution I developed, featuring a modern data engineering architecture: For security and confidentiality reasons, portions of the content and sensitive information have been intentionally blurred
- Data Warehousing: All data is housed in Google BigQuery for scalable, high-performance storage and analytics.
- ETL Pipeline: Custom Python-based ETL processes handle data extraction, transformation, and loading.
- Containerization: Deployed using Docker containers for consistent, reproducible execution environments.
- Cloud Infrastructure: The entire solution runs on Google Cloud Platform (GCP) - Artifact and Cloud Run deployment, leveraging its managed services for reliability and scalability.
This infrastructure allows for automated data processing, enabling real-time analytics and visualization through PowerBI. The modular architecture ensures easy maintenance and scalability as data volumes grow.
The dashboard provides actionable insights through carefully designed visualizations, helping stakeholders make data-driven decisions without needing to understand the complex technical infrastructure supporting it.
Dashboard 1
Dashboard 2
Dashboard 3
Dashboard 4
Dashboard 5
Exploratory Data Analysis
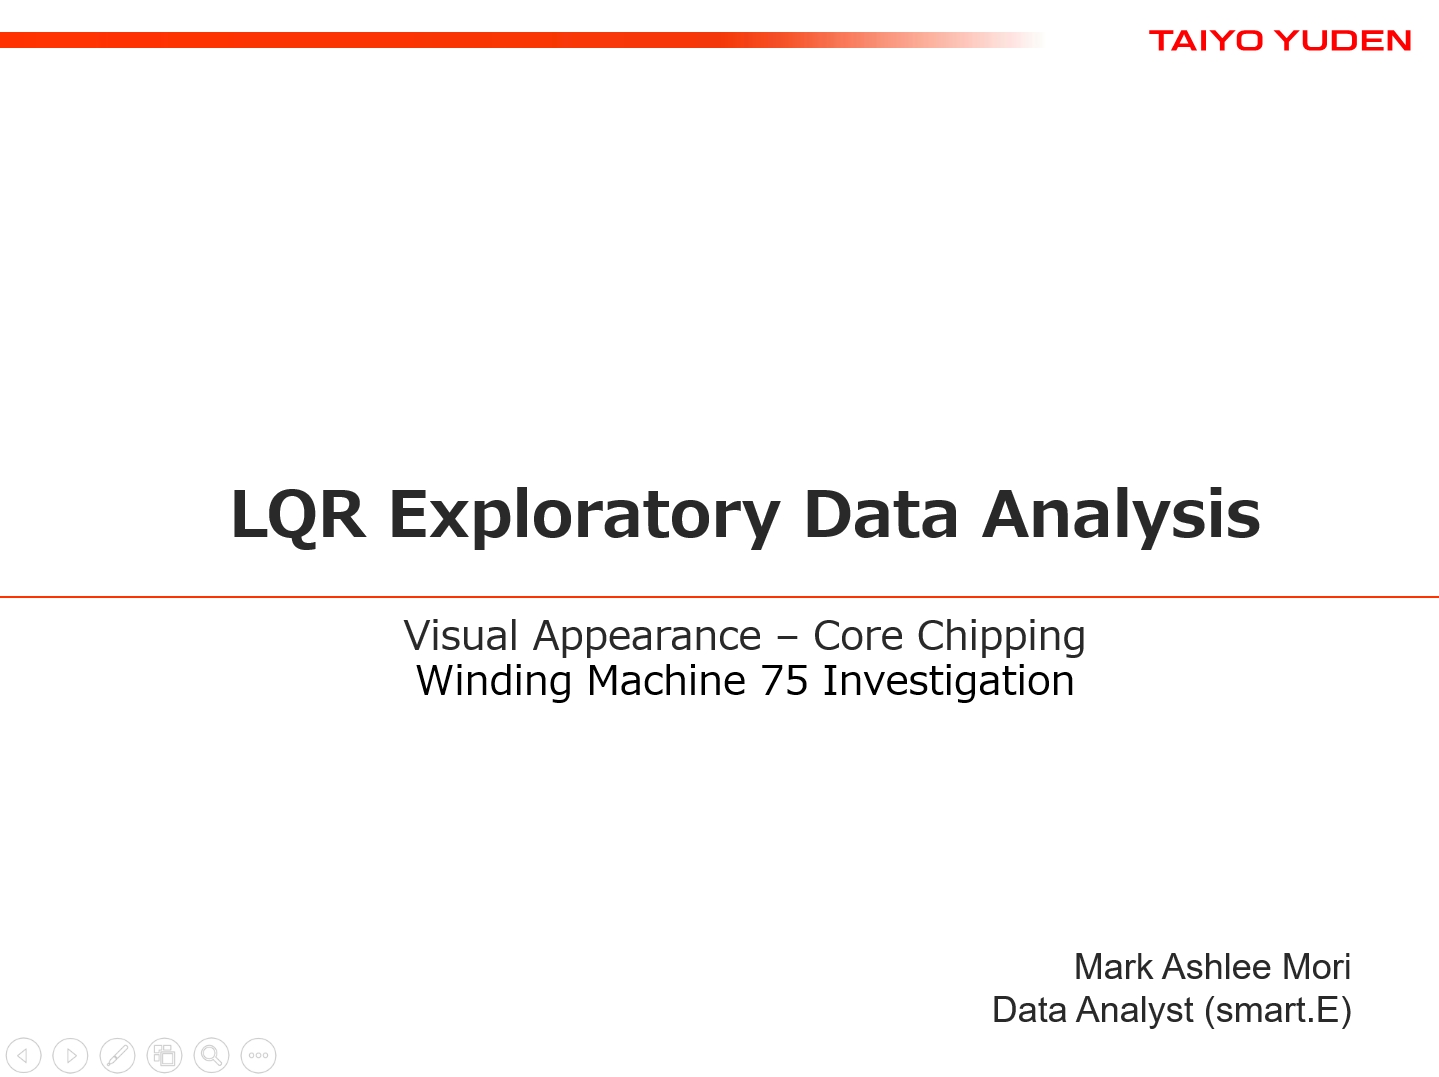
This personal project is rooted in my experience at my first company, Taiyo Yuden Philippines. Initially, I joined as a product engineer and later transitioned to the Tech department to work as a data analyst. This shift is a common trajectory for engineers, particularly those in electronics and communications, within the company. In this role, I collaborated with data scientists and data engineers to conduct exploratory data analysis on non-conforming products. Our primary objective was to design dashboards for real-time monitoring of product history, sourcing data from machines through IoT technology.
During the exploratory data analysis phase, our focus was on identifying the root cause or machine(s) responsible for a significant portion of non-conforming products in inductors. Utilizing available data from our database, I mapped out specific machines, conducted sampling, performed Fault Tree Analysis (FTA), and traced issues to their origins. Ultimately, our investigation led us to a specific component within a particular machine. Upon replacing this component, we observed a significant improvement in product quality.
Lot Number Segregation
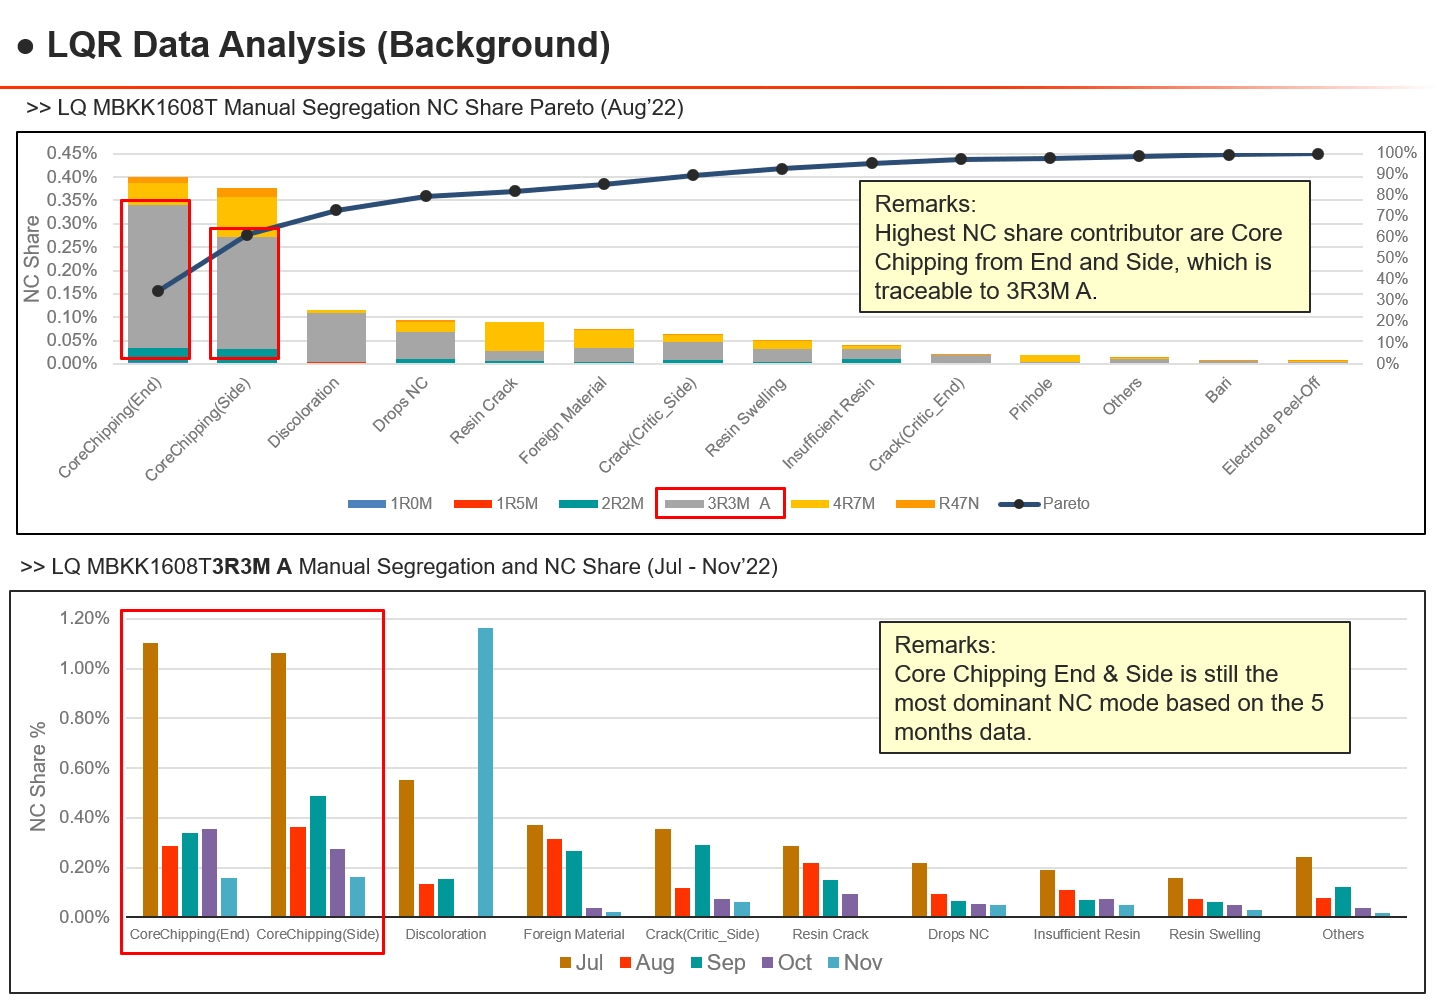
In this phase, our aim is to identify the lot numbers affected and pinpoint the primary issues associated with specific inductors. The data collected for this analysis is sourced from the company's database. From our findings, it is evident that the predominant lot number affected is "3R3M A," with the primary issue identified as "Core Chipping."
Which chuck number has an issue?
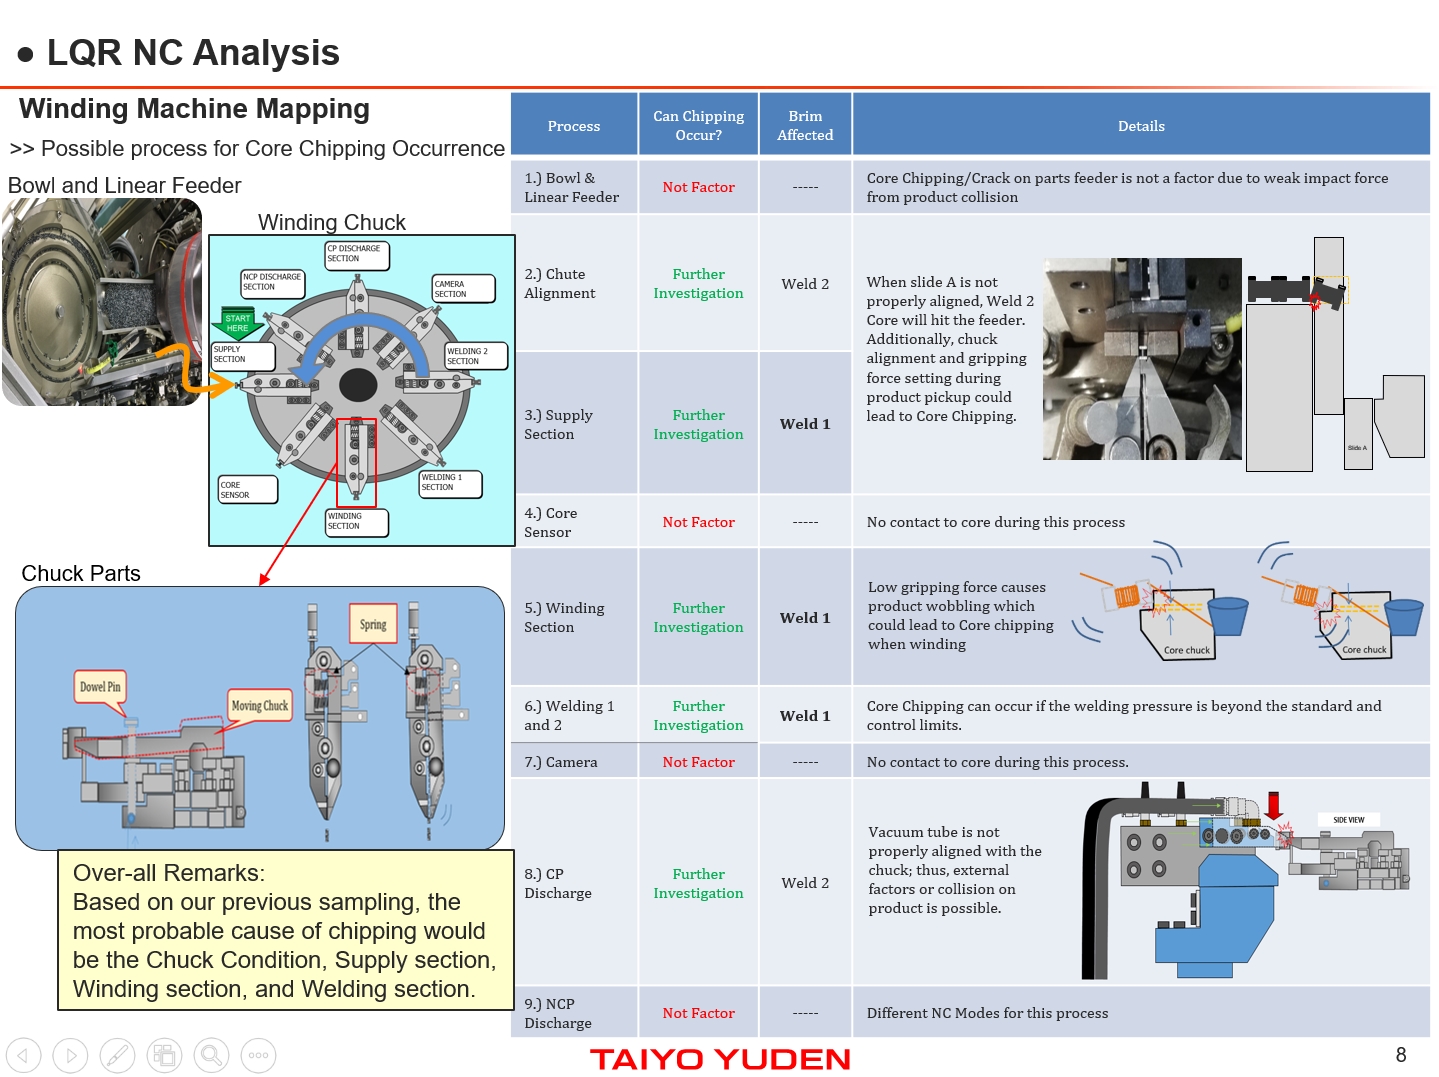
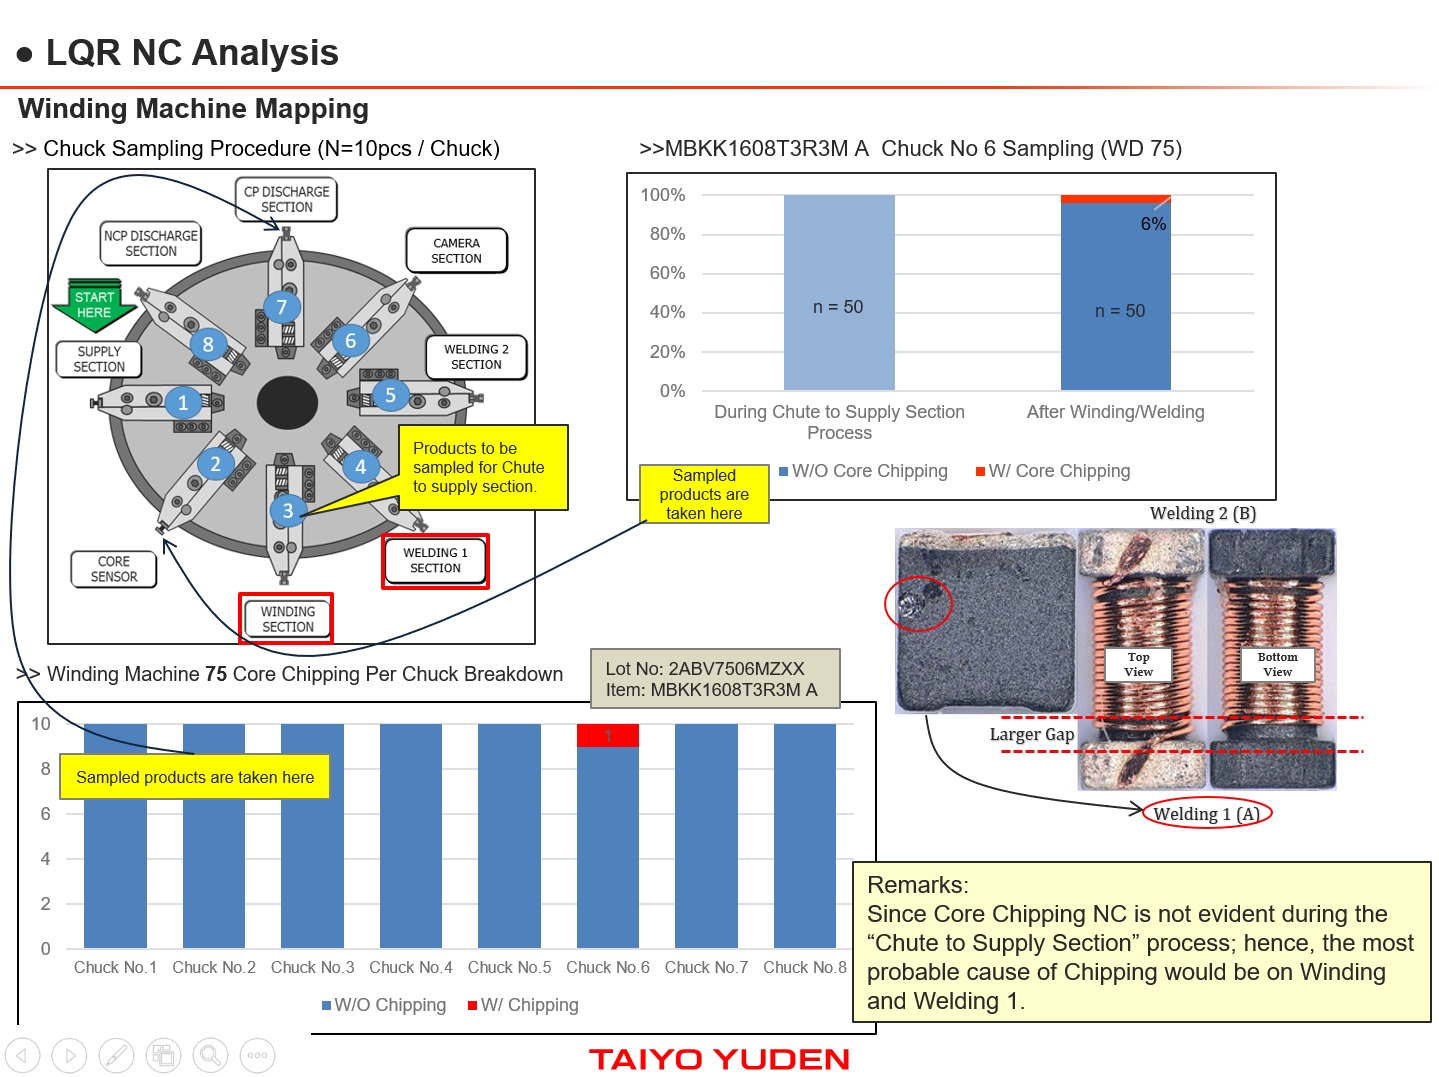
During this phase of data analysis, we presented the Japanese executives with a detailed explanation of our sampling methodology, demonstrating how we systematically assessed each chuck to identify any damage. Through this process, we pinpointed Chuck No. 6 as the primary contributor to the core chipping damages. Furthermore, visual evidence supports our findings, as it is apparent from images that the chuck holder associated with Chuck No. 6 is indeed broken.
Result after chuck replacement
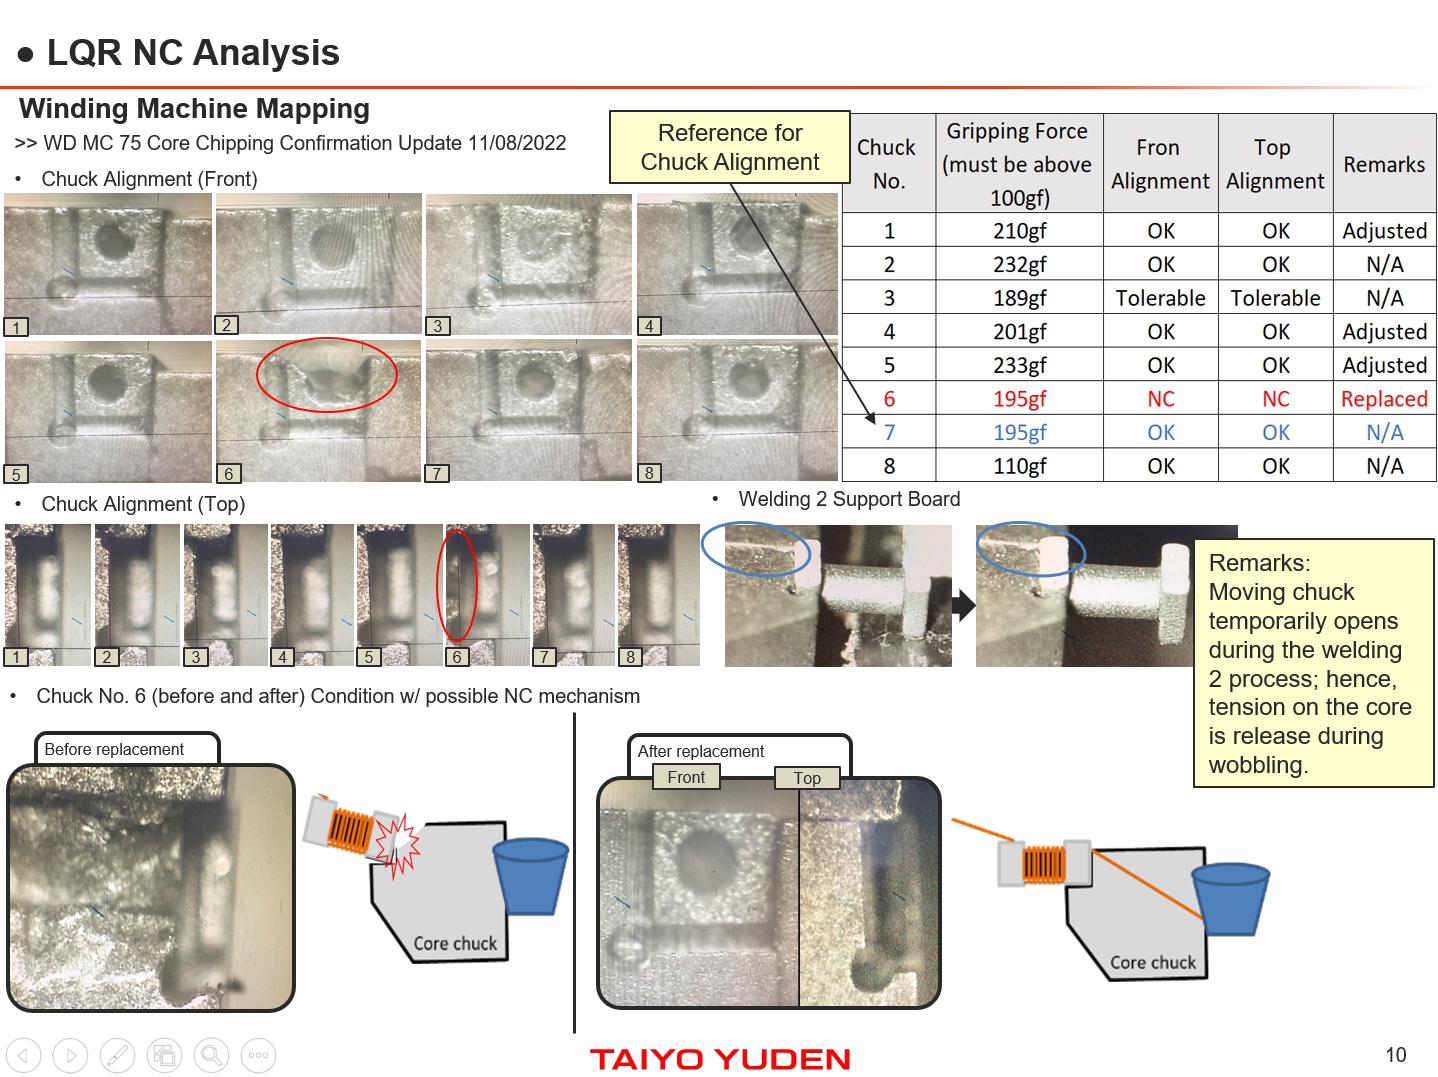
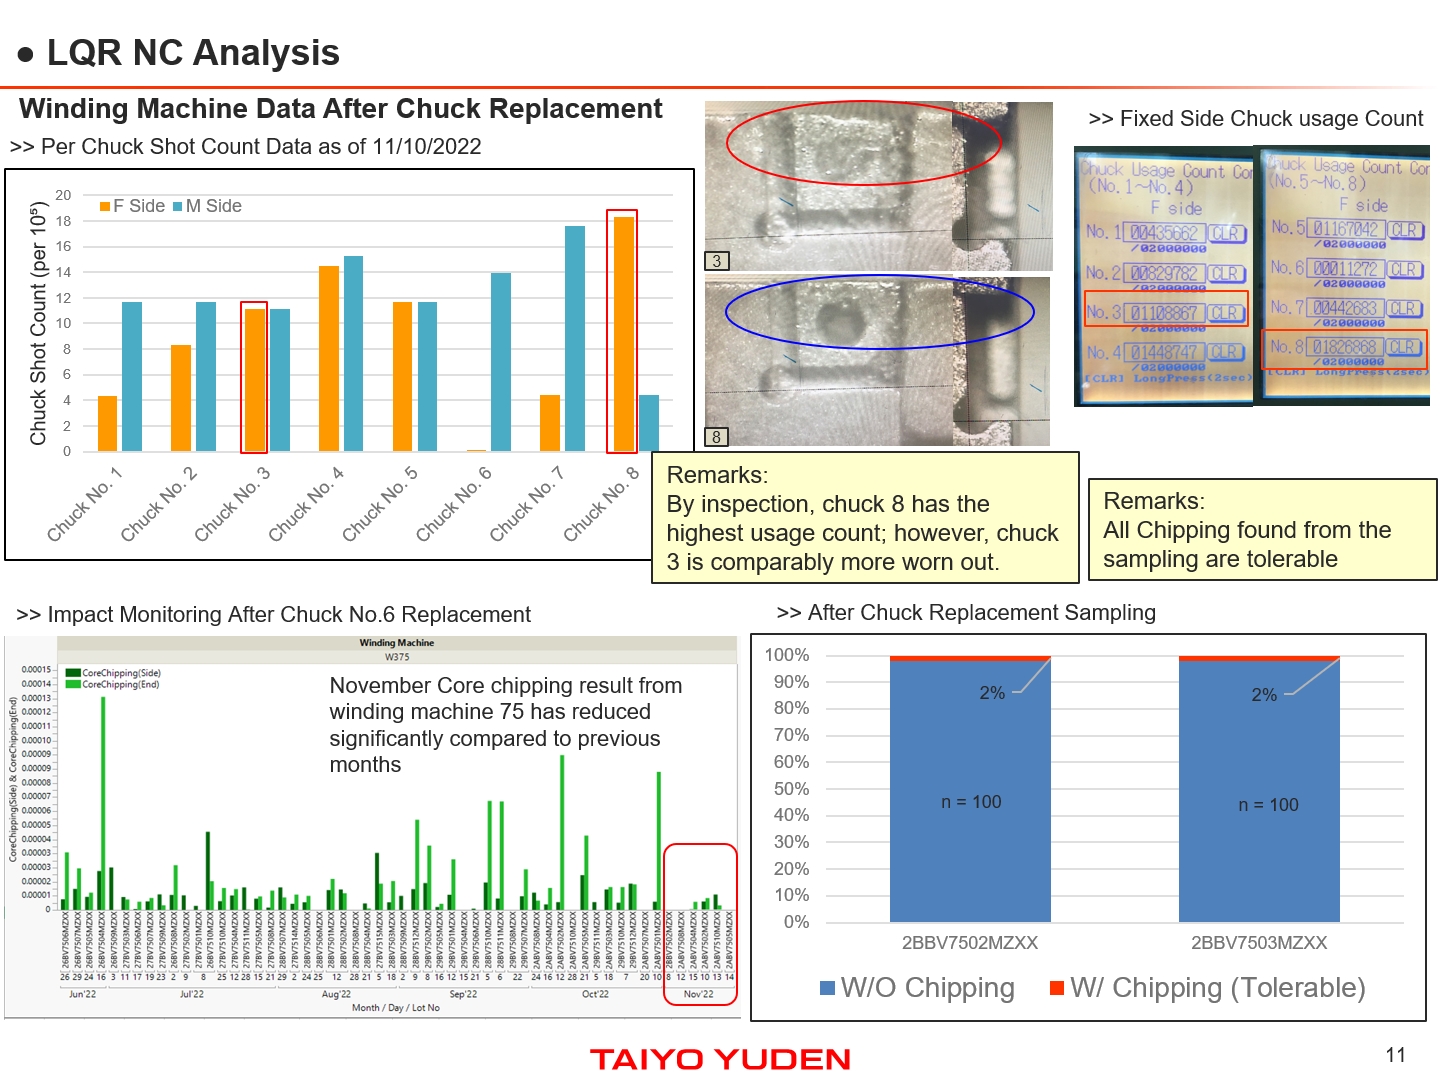
Following the chuck replacement, we replaced the broken chuck with a new one. Subsequently, on the final slide, we observed a significant decrease in core chipping issues with Winding Machine 75 in the November data. This reduction in non-conforming products has positively impacted the business, driving increased profitability.